File:Item drops graph ru.png
Size of this preview: 800 × 371 pixels. Other resolutions: 320 × 148 pixels | 1,135 × 526 pixels.
Original file (1,135 × 526 pixels, file size: 34 KB, MIME type: image/png)
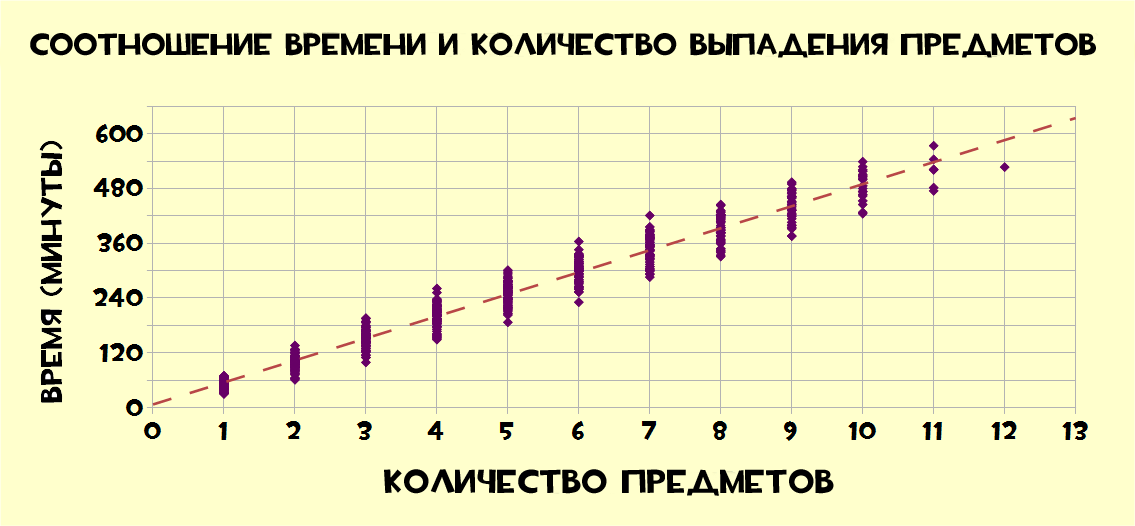
A graph displaying the relationship between time and number of item drops in TF2, Russia translation. You can recreate this graph using the data found here.
File history
Click on a date/time to view the file as it appeared at that time.
 | IMPORTANT: Thumbnails may not be displayed correctly.
Due to problems with the server-side caching system, new versions of images will not be displayed for up to several days. DO NOT REVERT this image to an older version if the current version is not showing correctly. Wait for the cached thumbnails to update instead.
|
| Date/Time | Thumbnail | Dimensions | User | Comment | |
|---|---|---|---|---|---|
| current | 18:15, 10 October 2011 | | 1,135 × 526 (34 KB) | Cappy (talk | contribs) | Better version |
| 20:20, 4 October 2011 | 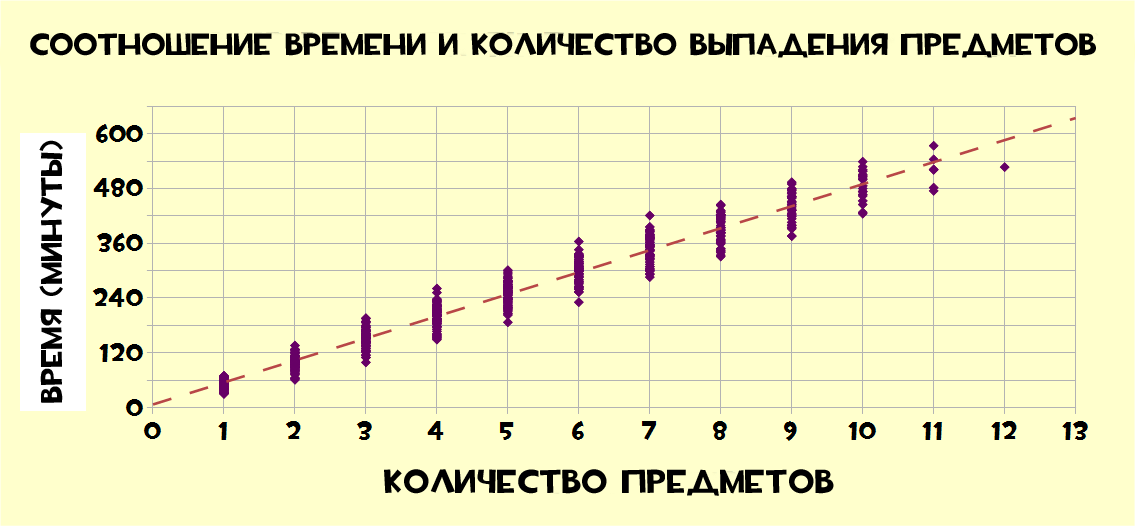 | 1,135 × 526 (34 KB) | WindBOT (talk | contribs) | Crushed version: 22% reduction / 9449 bytes saved; from 43848 to 34399 bytes. | |
| 20:09, 4 October 2011 |  | 1,135 × 526 (43 KB) | CsS (talk | contribs) | Changed | |
| 19:59, 4 October 2011 |  | 1,135 × 526 (43 KB) | CsS (talk | contribs) | A graph displaying the relationship between time and number of item drops in TF2, Russia translation. You can recreate this graph using the data found [http://dl.dropbox.com/u/105828/Item%20drops.csv here]. |
- You cannot overwrite this file.
File usage
The following page links to this file: